Malware Unpacking With Memory Dumps - Intermediate Methods (Pe-Sieve, Process Hacker, Hxd and Pe-bear)
Demonstrating three additional methods for obtaining unpacked malware samples. Using Process Hacker, Pe-sieve, Hxd and Pe-bear.
Demonstrating three additional methods for obtaining unpacked malware samples. Using Process Hacker, Pe-sieve, Hxd and Pe-bear.
In a previous post, we demonstrated a method for unpacking an Asyncrat malware sample by utilising Process Hacker and Dnspy.
We leveraged Process Hacker to identify a suspicious process, then utilised Dnspy to attach to the process and enumerate loaded modules. From there we were able to open a suspicious module from memory, which ultimately obtained the unpacked Asyncrat malware sample.
In this post, we'll go over some additional methods for obtaining the same unpacked payload.
We will assume that you have downloaded and unzipped the file from the previous post. You can also obtain the file here.
SHA256: 05c2195aa671d62b3b47ff42630db25f39453375de9cffa92fc4a67fa5b6493b
We will also assume that you have executed the file inside of a safe virtual machine, which will result in a running process of aspnet_compiler.exe. (This is the file which the malware has injected itself into)
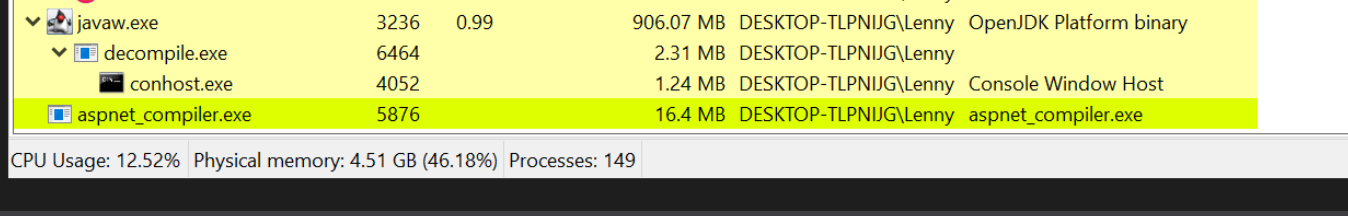
In the initial post, we monitored for the creation of aspnet_compiler.exe using process hacker.
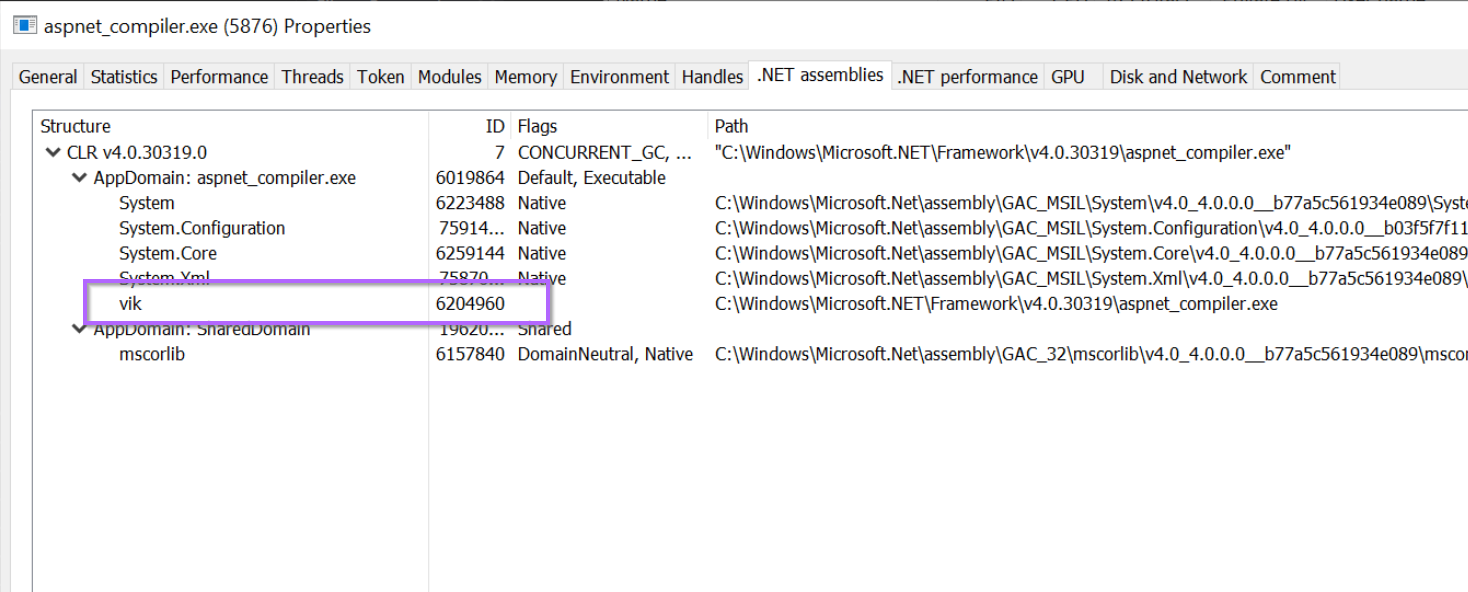
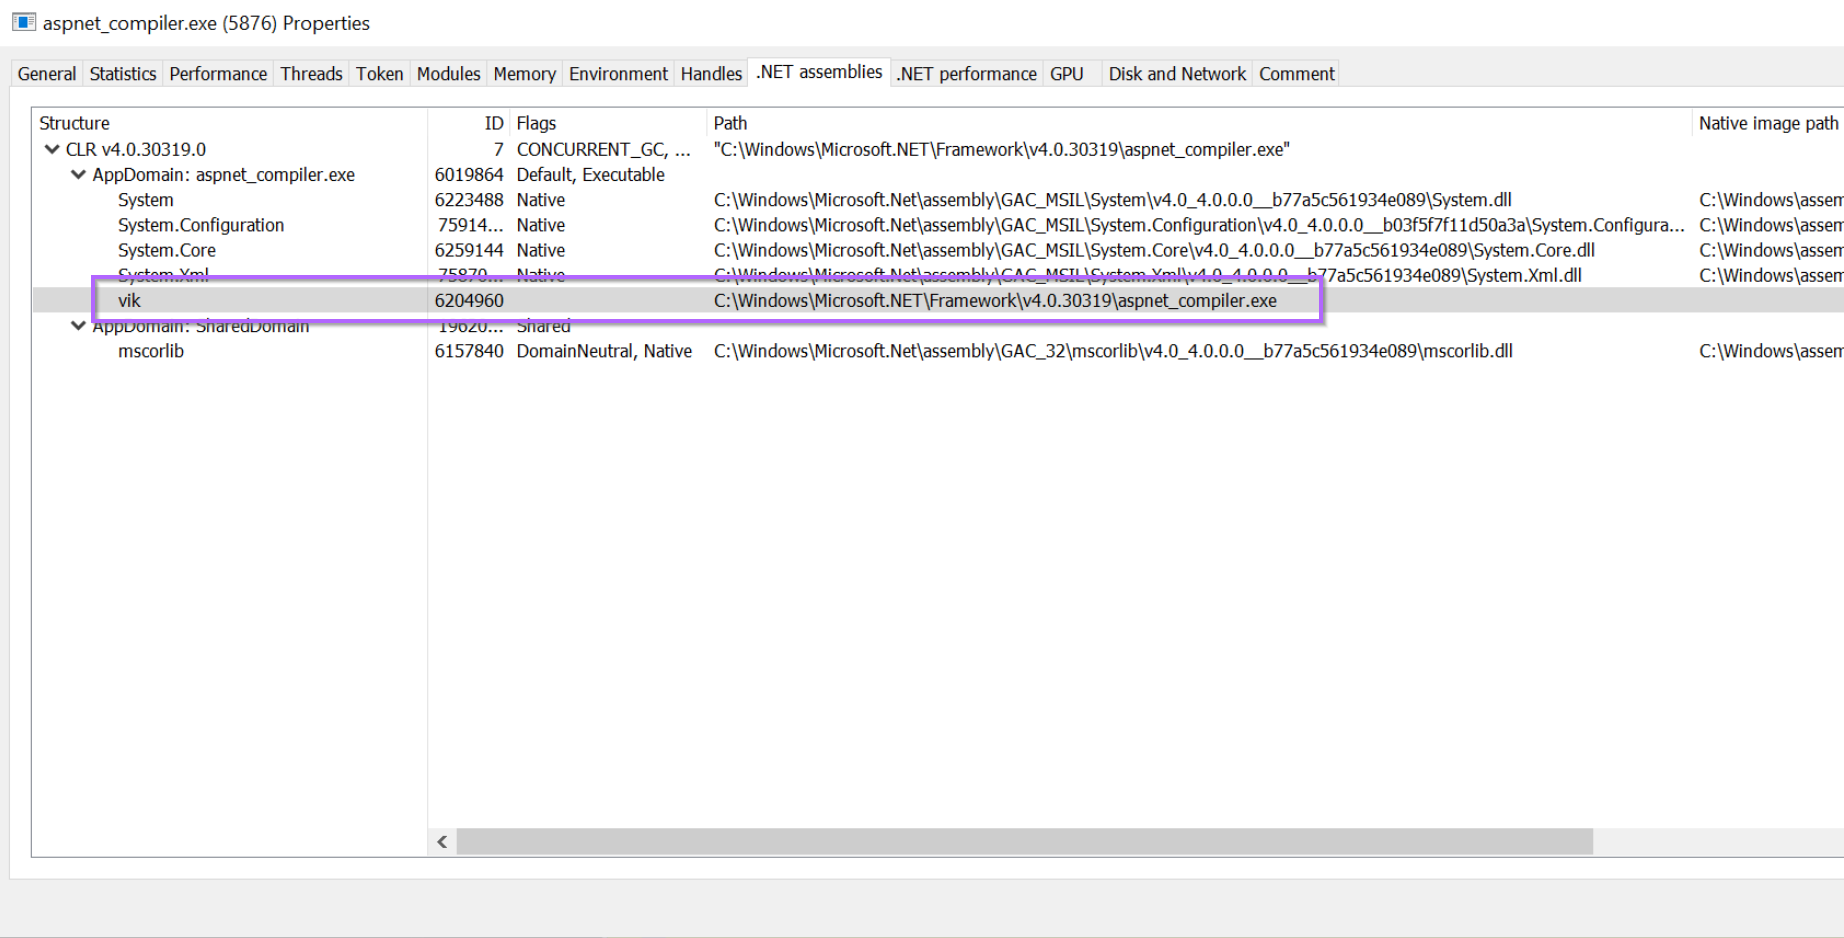
We then used Process Hacker to view loaded .NET assemblies, which resulted in the identification of a suspicious vik module, which appeared to have overwritten the original aspnet_compiler.exe
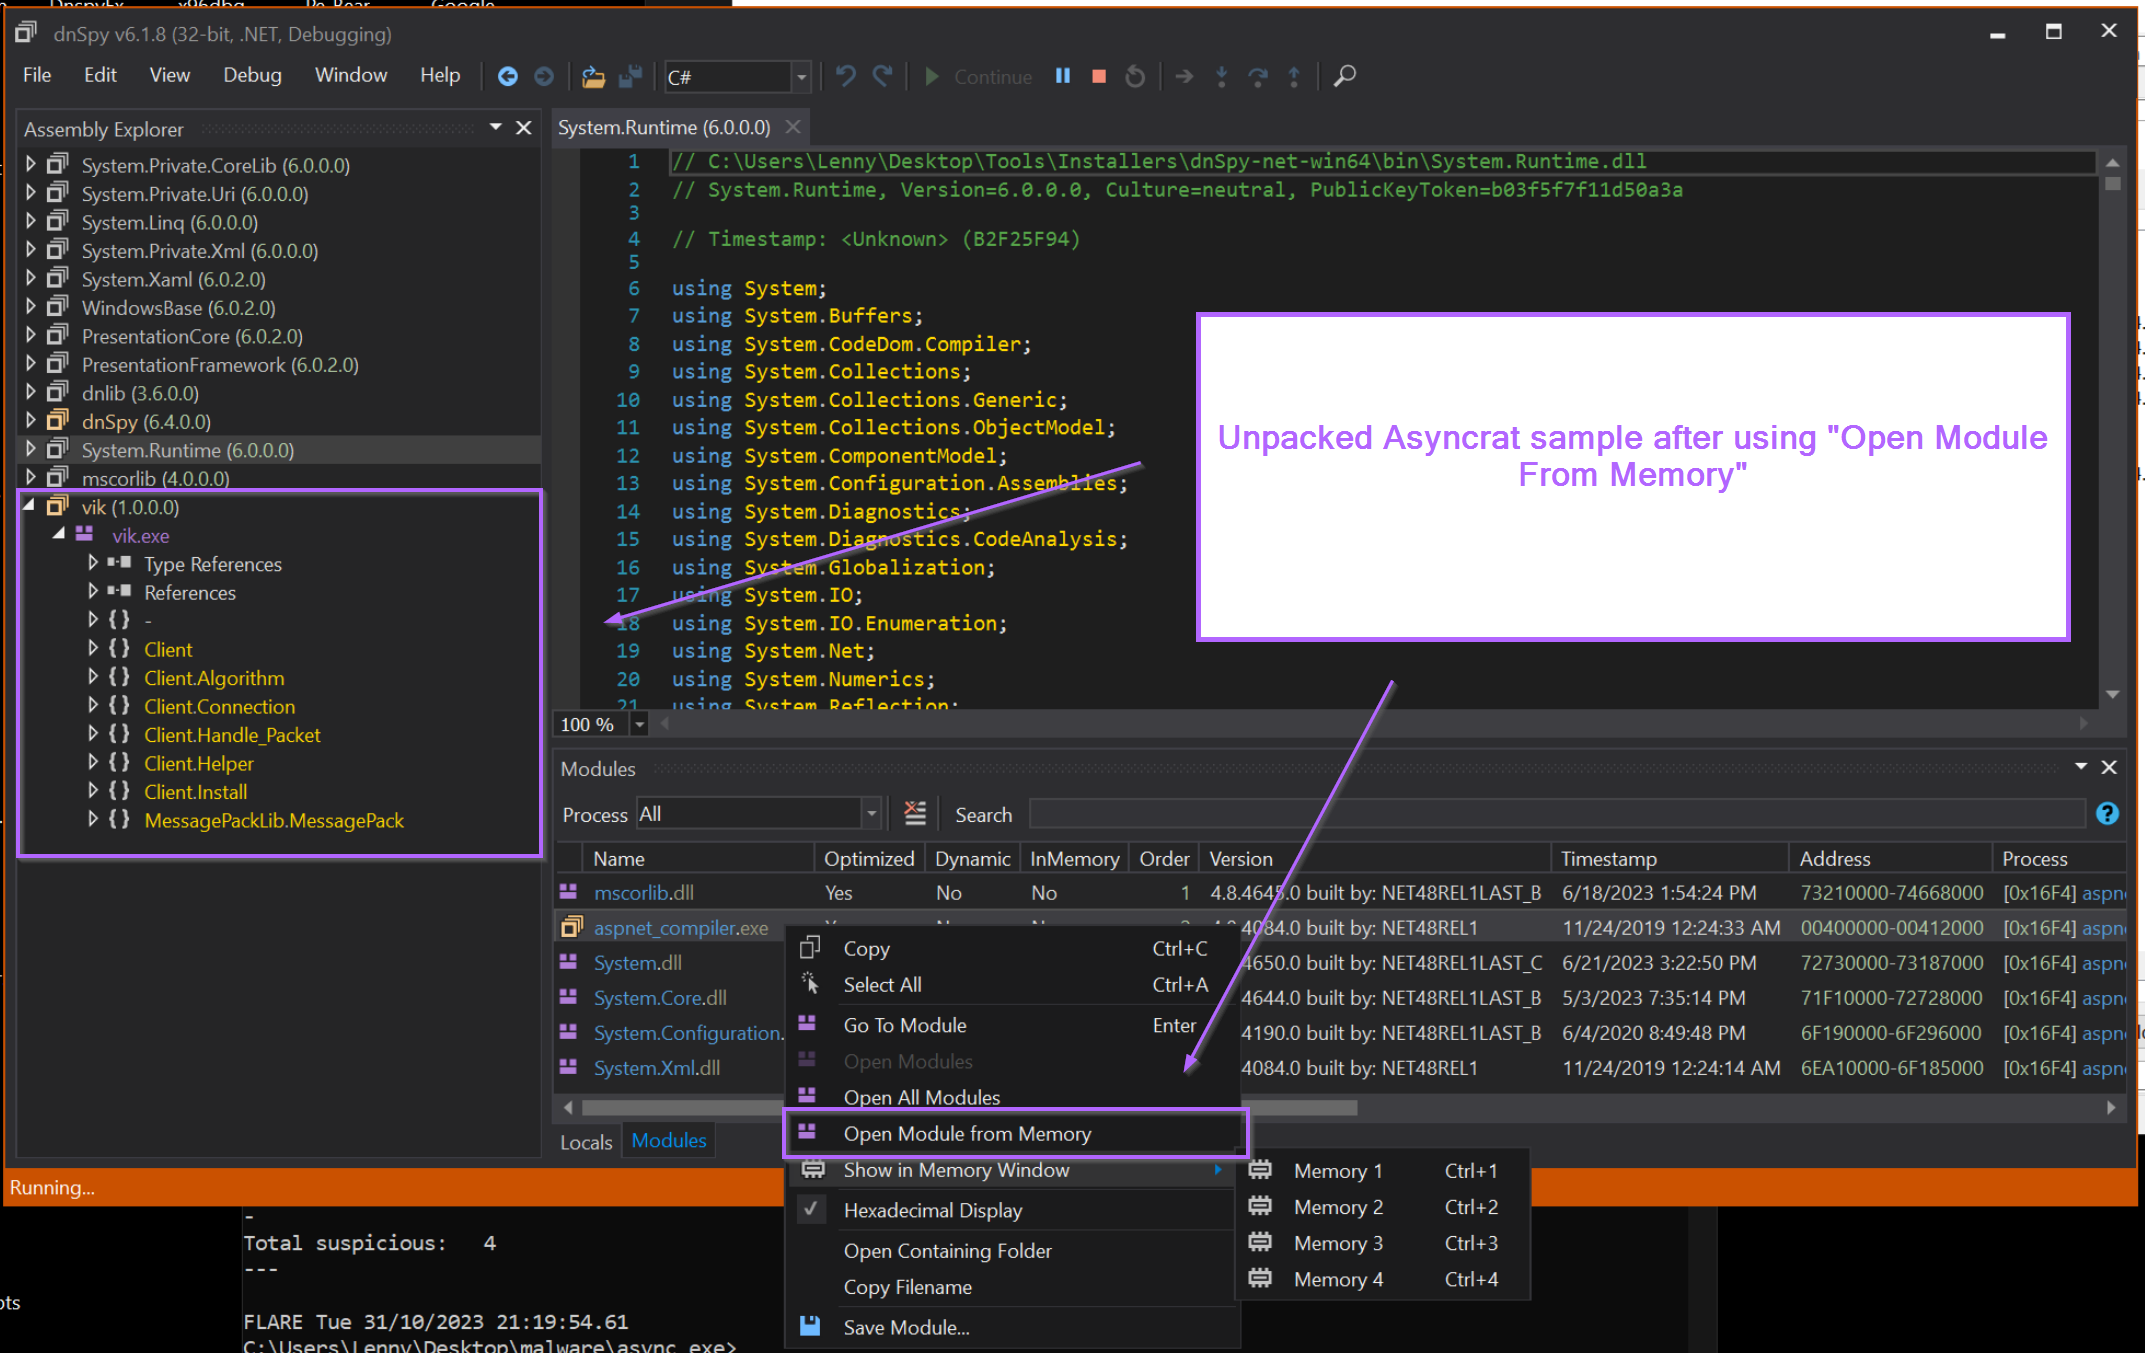
We then used Dnspy to attach to the suspicious aspnet_compiler.exe process.
This enabled us to view all loaded modules and open the aspnet_compiler.exe file from memory.
By opening the file from memory, we were able to obtain the Asyncrat sample that had overwritten the "real copy" of aspnet_compiler.exe
With the recap covered, we will now go over some additional methods that could have been used to obtain the unpacked sample.
These methods work equally as effectively on this particular sample, and also work on samples that are not based on .NET (and hence where Dnspy would not be able to work).
Pe-sieve is one of the quickest and most effective ways to obtain an unpacked sample.
Pe-sieve works by scanning a running process for any suspicious modules that may have been injected or overwritten into memory. If a suspicious module has been identified, pe-sieve will obtain it and save it for you.
Pe-sieve is an extremely effective and easy-to-use tool.
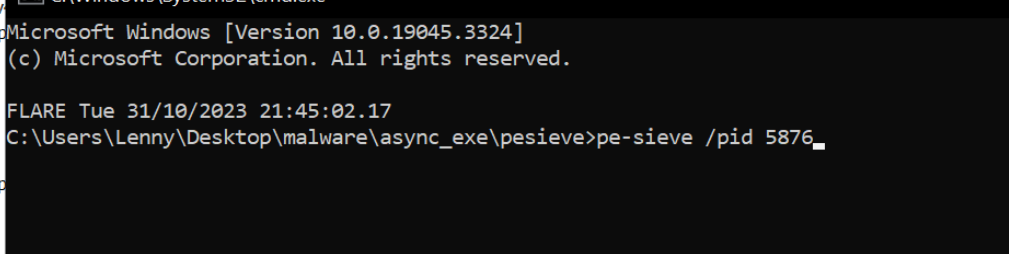
In the previous screenshot, we identified the suspicious process aspnet_compiler.exe, and we can see that it's process id (pid) is 5876.
To scan the process and obtain the unpacked payload, we can run pe-sieve and pass the pid parameter of 5876 (or whichever the pid is in your situation).
To pass the parameter, we can run the command pe-sieve /pid 5876
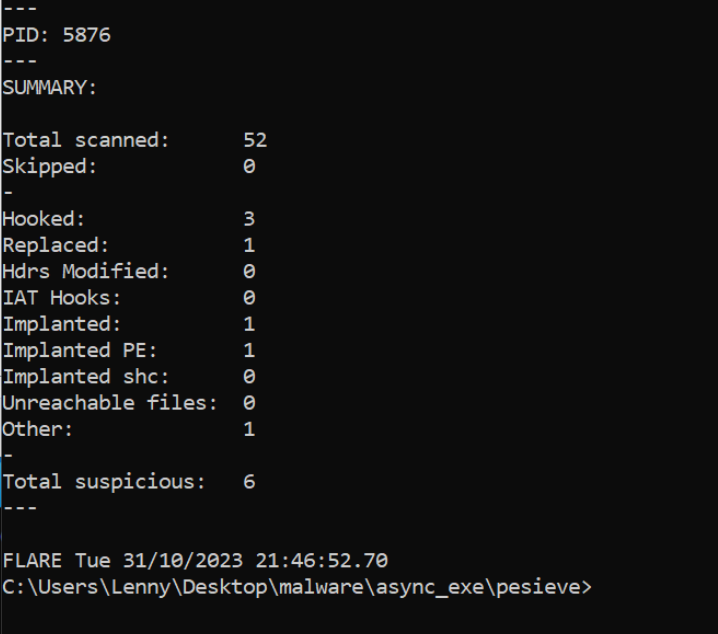
After running the command, you may see a bunch of text come up on the screen. You can largely ignore the text and skip straight to the end.
Here we can see the scan summary, indicating that 52 modules were scanned and 1 "implanted PE" was identified.
A new folder process_5876 will be created from where you ran the command.
Inside this folder contains a series of files that pe-sieve obtained from memory.
One of these files corresponds to aspnet_compiler.exe. Which we previously identified as potentially being overwritten by malware.
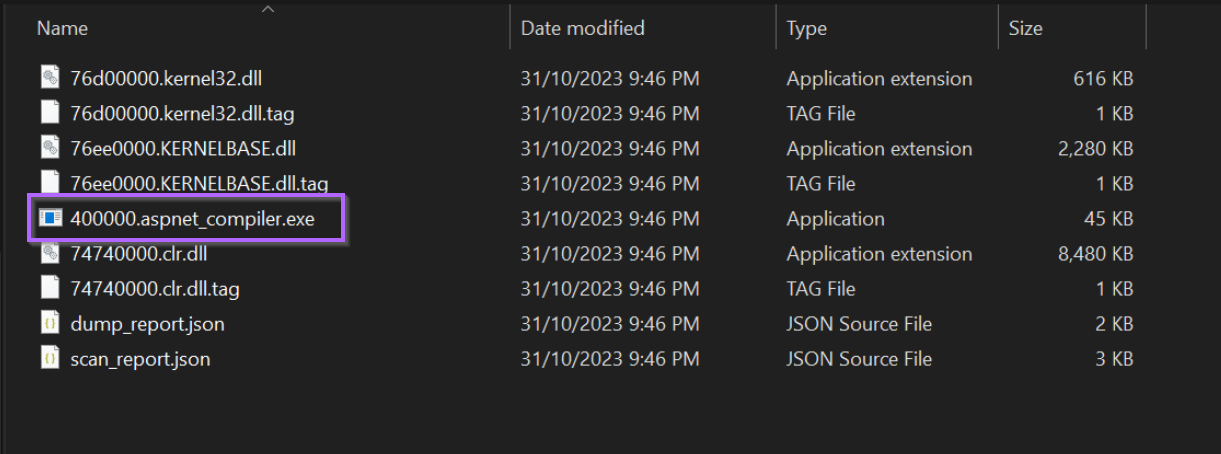
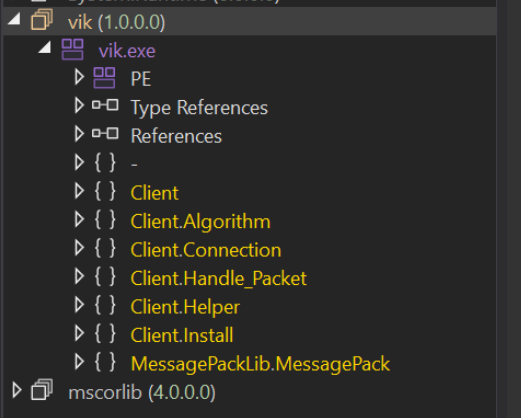
By opening the 40000.aspnet_compiler.exe inside of Dnspy, we can see the unpacked payload.
This is the same vik file as identified in the initial post. In this case, we have obtained the same file by using pe-sieve.
If you enjoyed this section, you may enjoy the next two sections which are available for paid members of the site.
Becoming a paid member grants you access to all future bonus content. And helps support the creation of more blogs. You will also get access to a discord server where you can ask questions and receive guidance and help.
In the next two sections, you can learn how to
It is also possible to obtain the unpacked file directly using only Process Hacker.
Recall that we previously used Process Hacker and the .NET Assemblies tab to identify the suspicious vik module. Which had a corresponding "Path" of aspnet_compiler.exe
We can use this knowledge to assume that the malware has overwritten the original aspnet_compiler.exe file in memory.
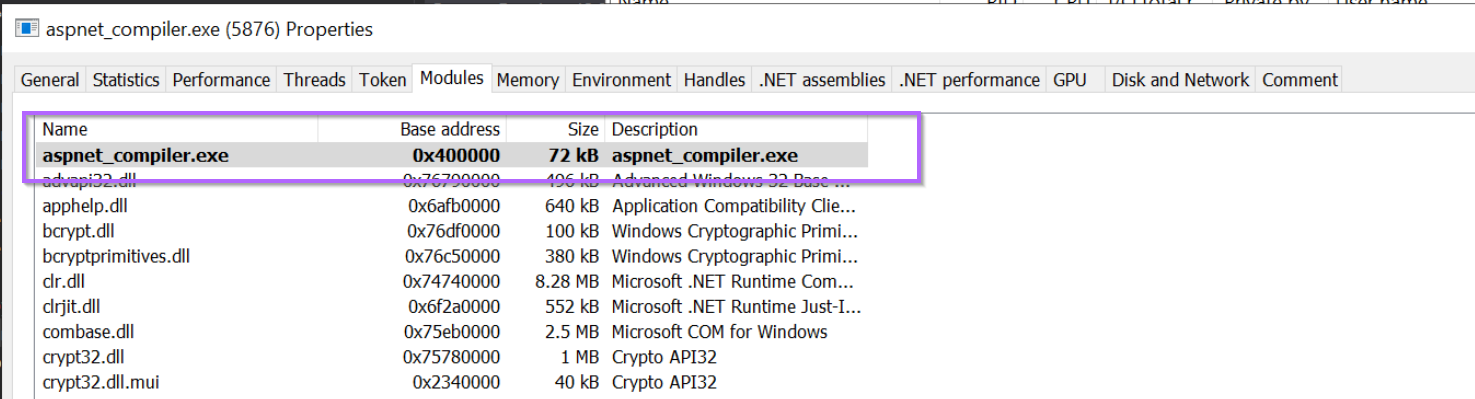
By browsing to the Modules tab of Process Hacker, we can obtain the base address of which aspnet_compiler.exe has been loaded into memory.
We can then go hunting at this base address, again running with the assumption that the original content has been overwritten with Malware.
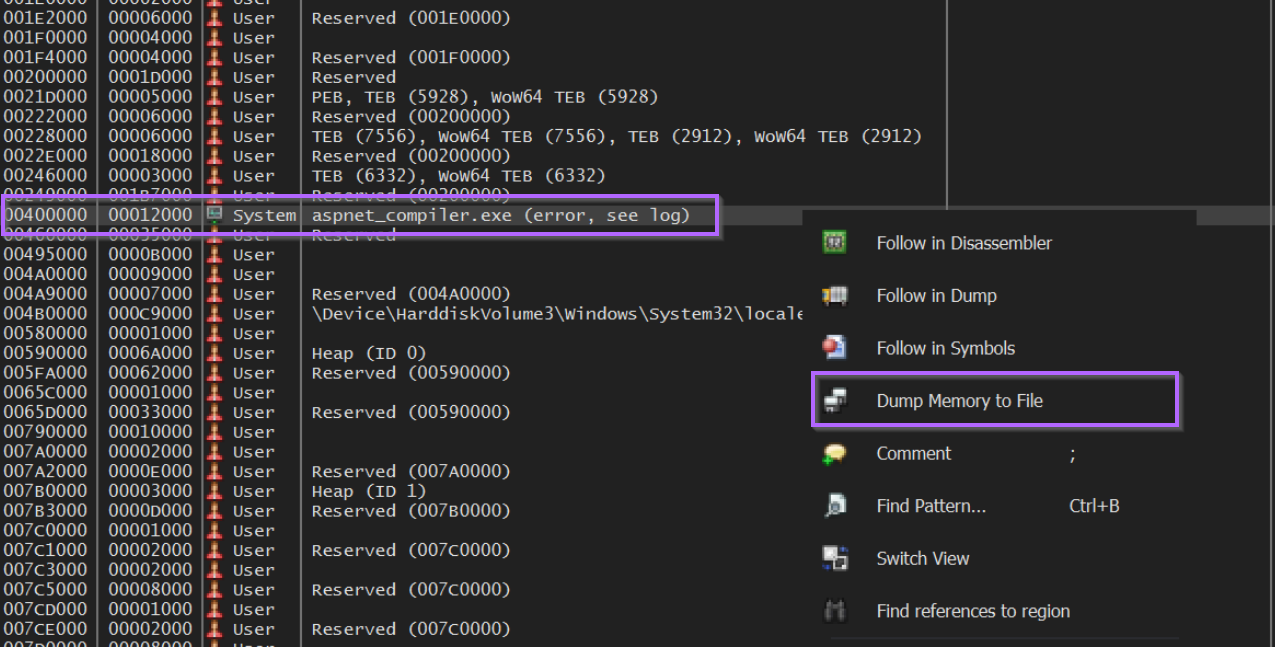
Browsing to the Memory tab, we can locate this base address and inspect it more closely.
It's interesting to note that 0x400000 has RWX permissions. Which is a useful indicator that something is odd here. 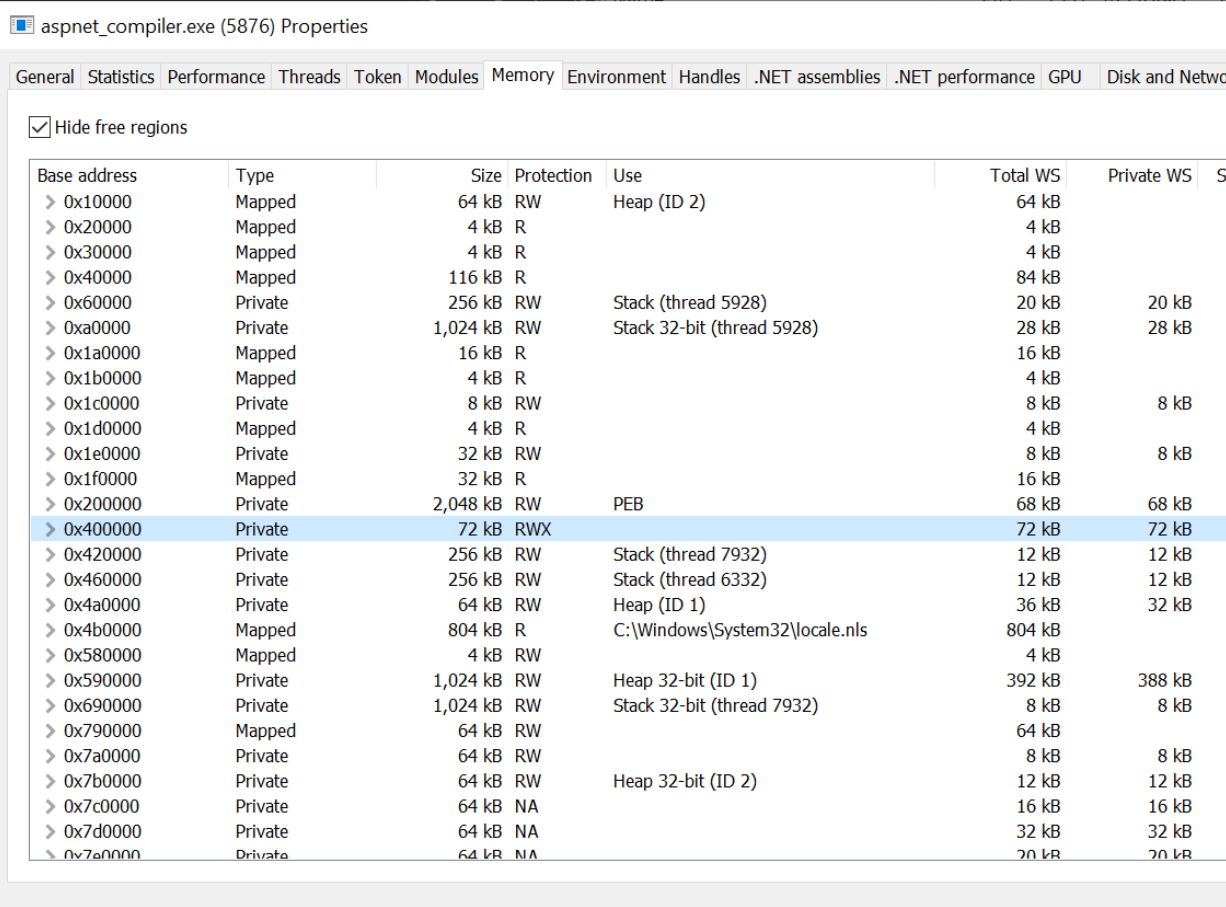
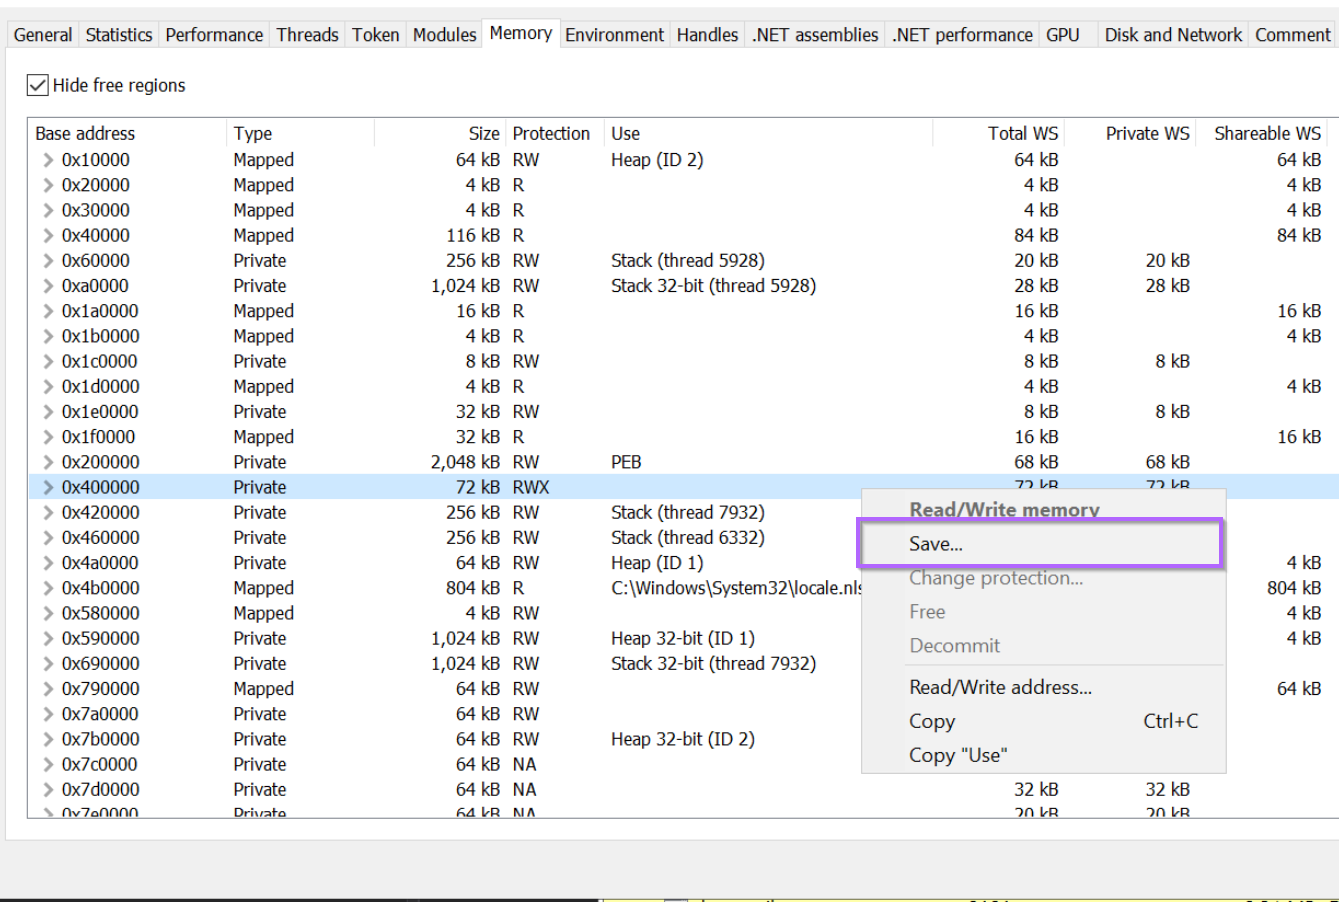
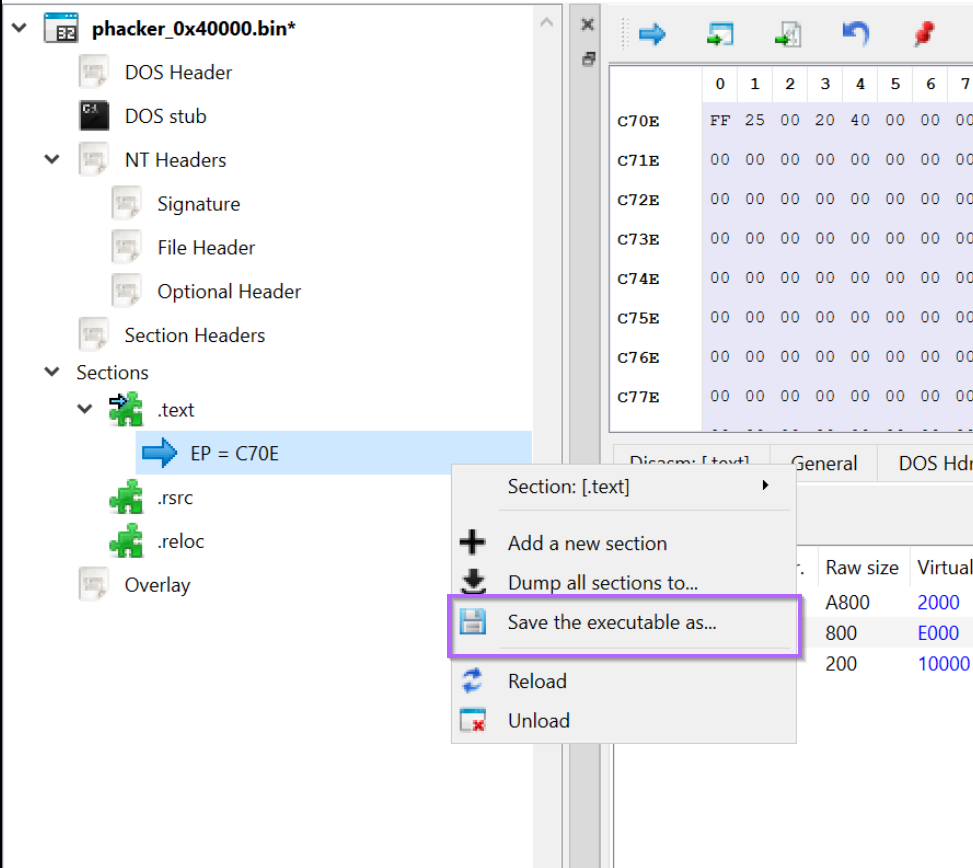
By right-clicking on the memory region 0x40000, we can save it to disk for further inspection.
I will go ahead and save the file as phacker_0x40000.bin.
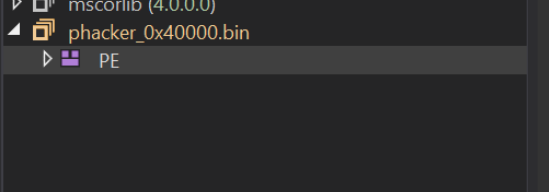
With the memory region now saved as phacker_0x40000.bin, we can go ahead and open it inside of DnSpy.
But something is wrong, the file loads as a PE but there is no decompiled code or identified .NET modules.
This is because we have saved the module "directly" from memory, which means that the content is already loaded and remapped to virtual addresses. The memory sections are aligned to their "virtual" addresses rather than the "raw" addresses.
The TLDR on this is that the contents of the memory dump are not aligned to their expected places, and some slight fixing needs to be done. This is common when saving a pe file directly from memory.
Luckily it's simple to fix this with another tool called pe-bear. (From the same developer of pe-sieve @hasherazade)
To correctly load the file within Dnspy, we first need to correct the section headers using Pe-bear.
First, we can open our file by dragging it to the pe-bear icon.
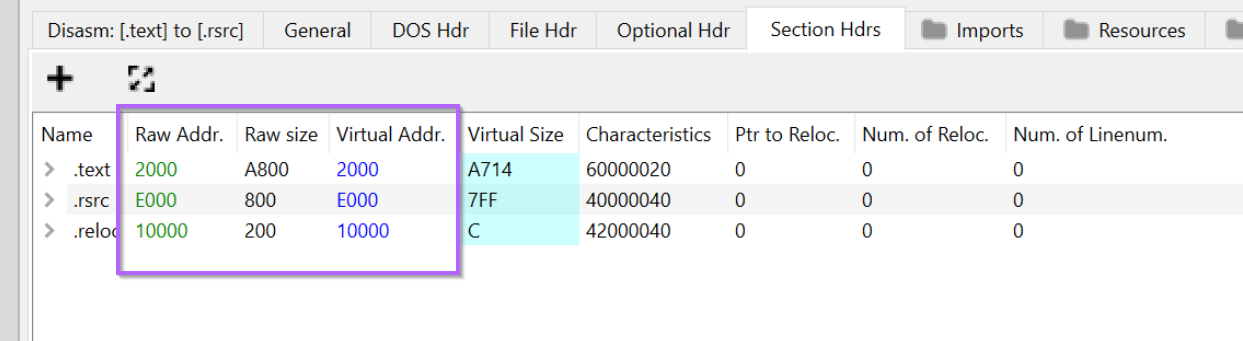
Once the file is loaded, we can browse directly to the "Section Headers" tab. Here we can see the "raw" addresses where most tooling will expect to find the associated section.
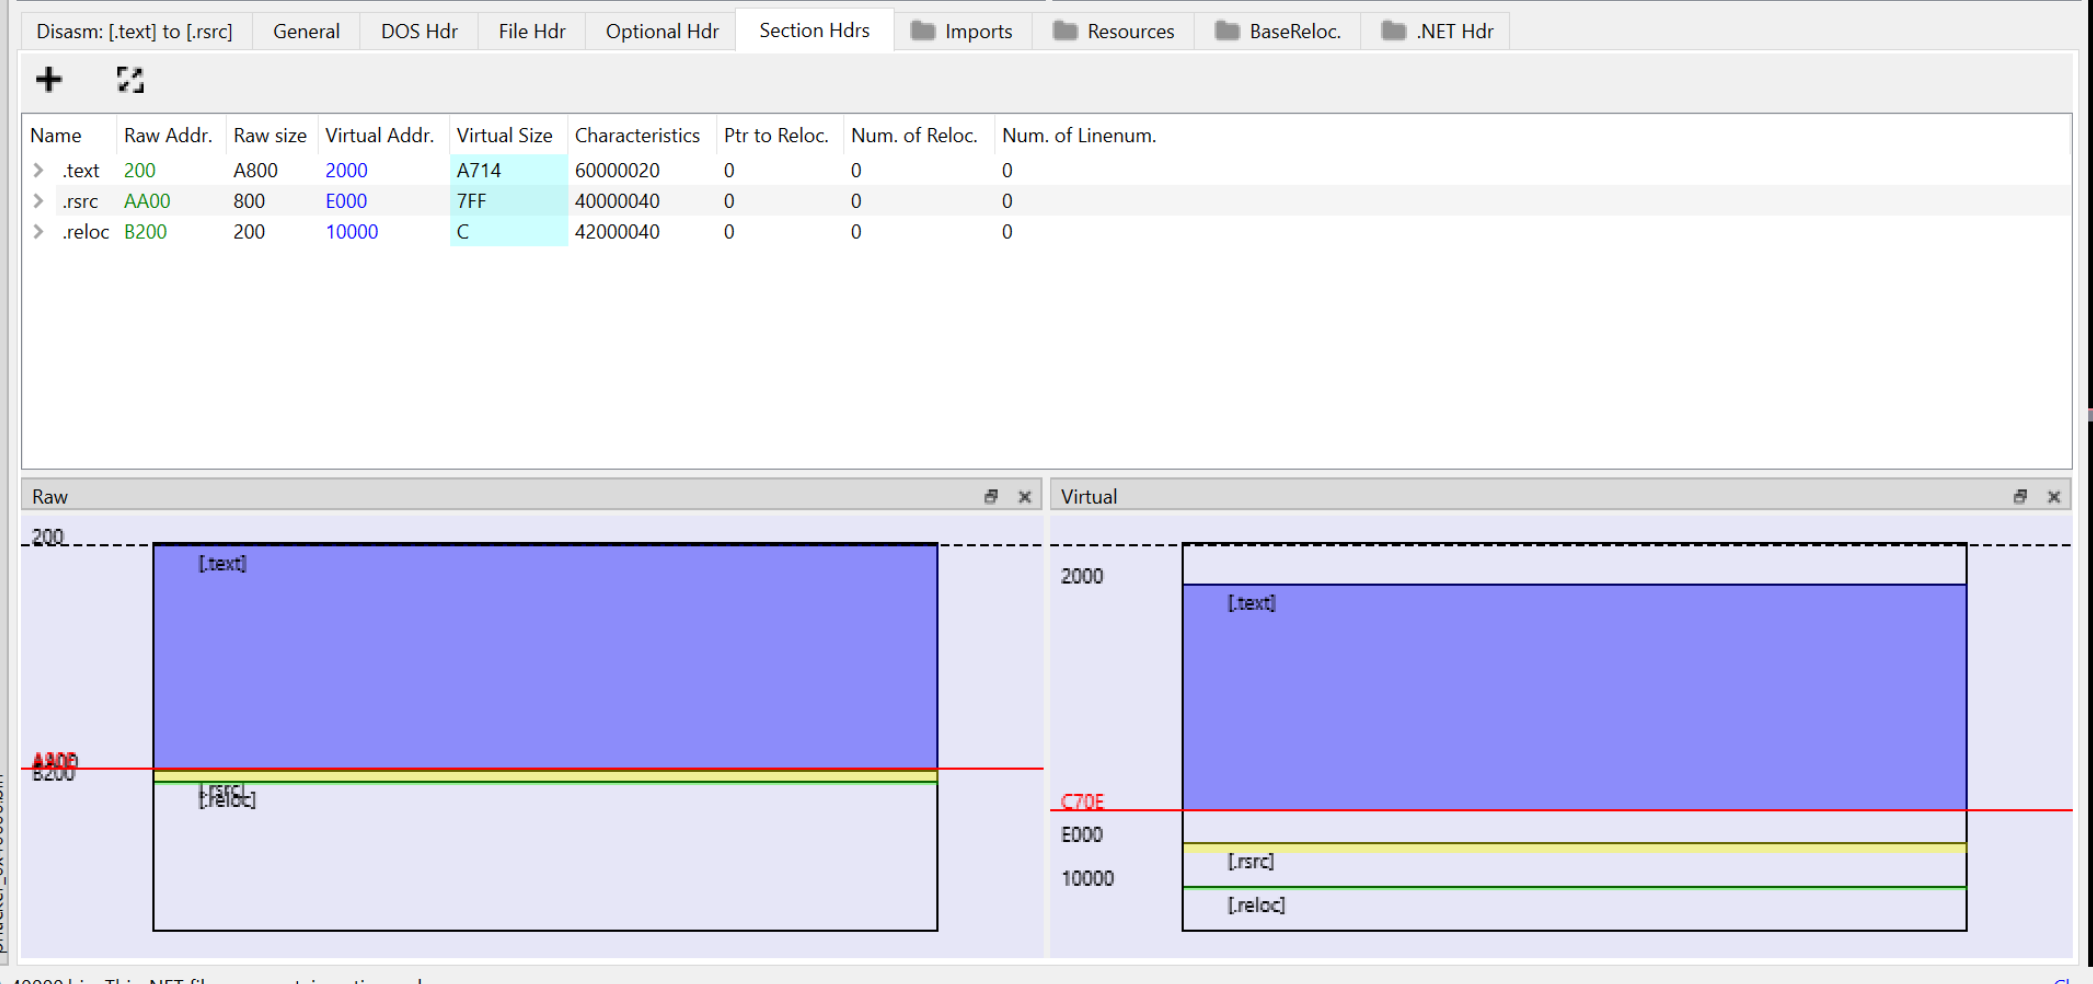
We can see above that the .text section should be at a location of 0x200.
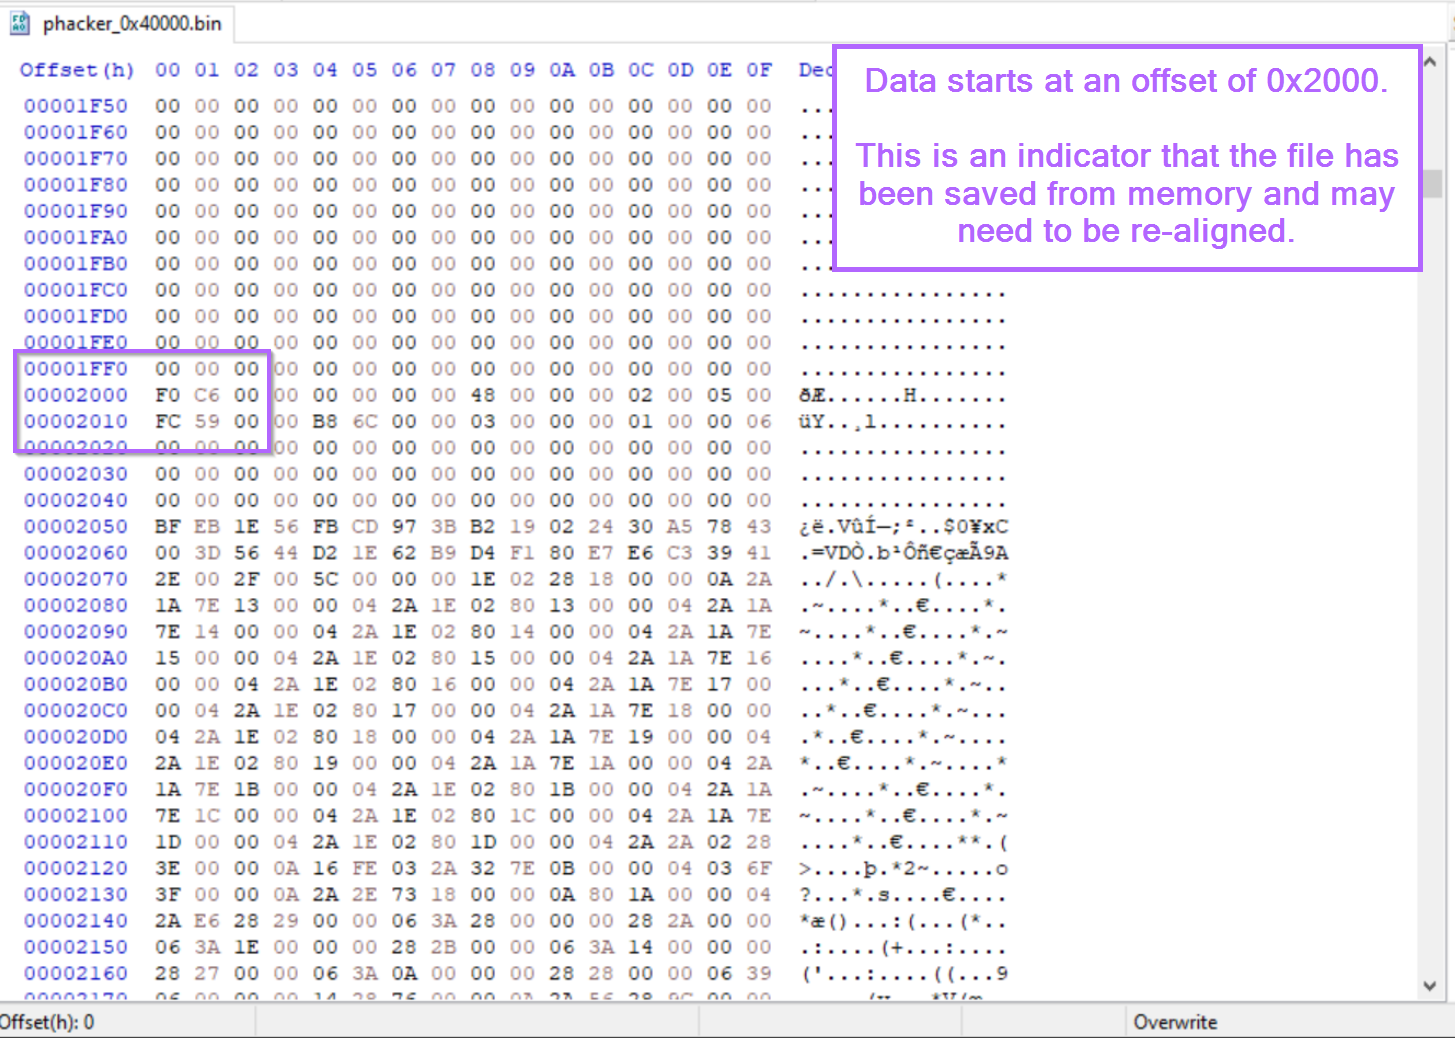
If we open the file inside of a hex editor, we can see that it starts at 0x2000. Which is the virtual address seen in pe-bear. This is an indicator that the section headers will need to be re-aligned.
With confirmation that the sections are contained at their "virtual" addresses. We can go ahead and redirect the raw addresses to their virtual address.
When we load the file in Dnspy, Dnspy starts looking for .text data at the Raw Address. For pe files saved from memory, this may not always be where the data actually is. This requires occasional fixing as we're doing here. 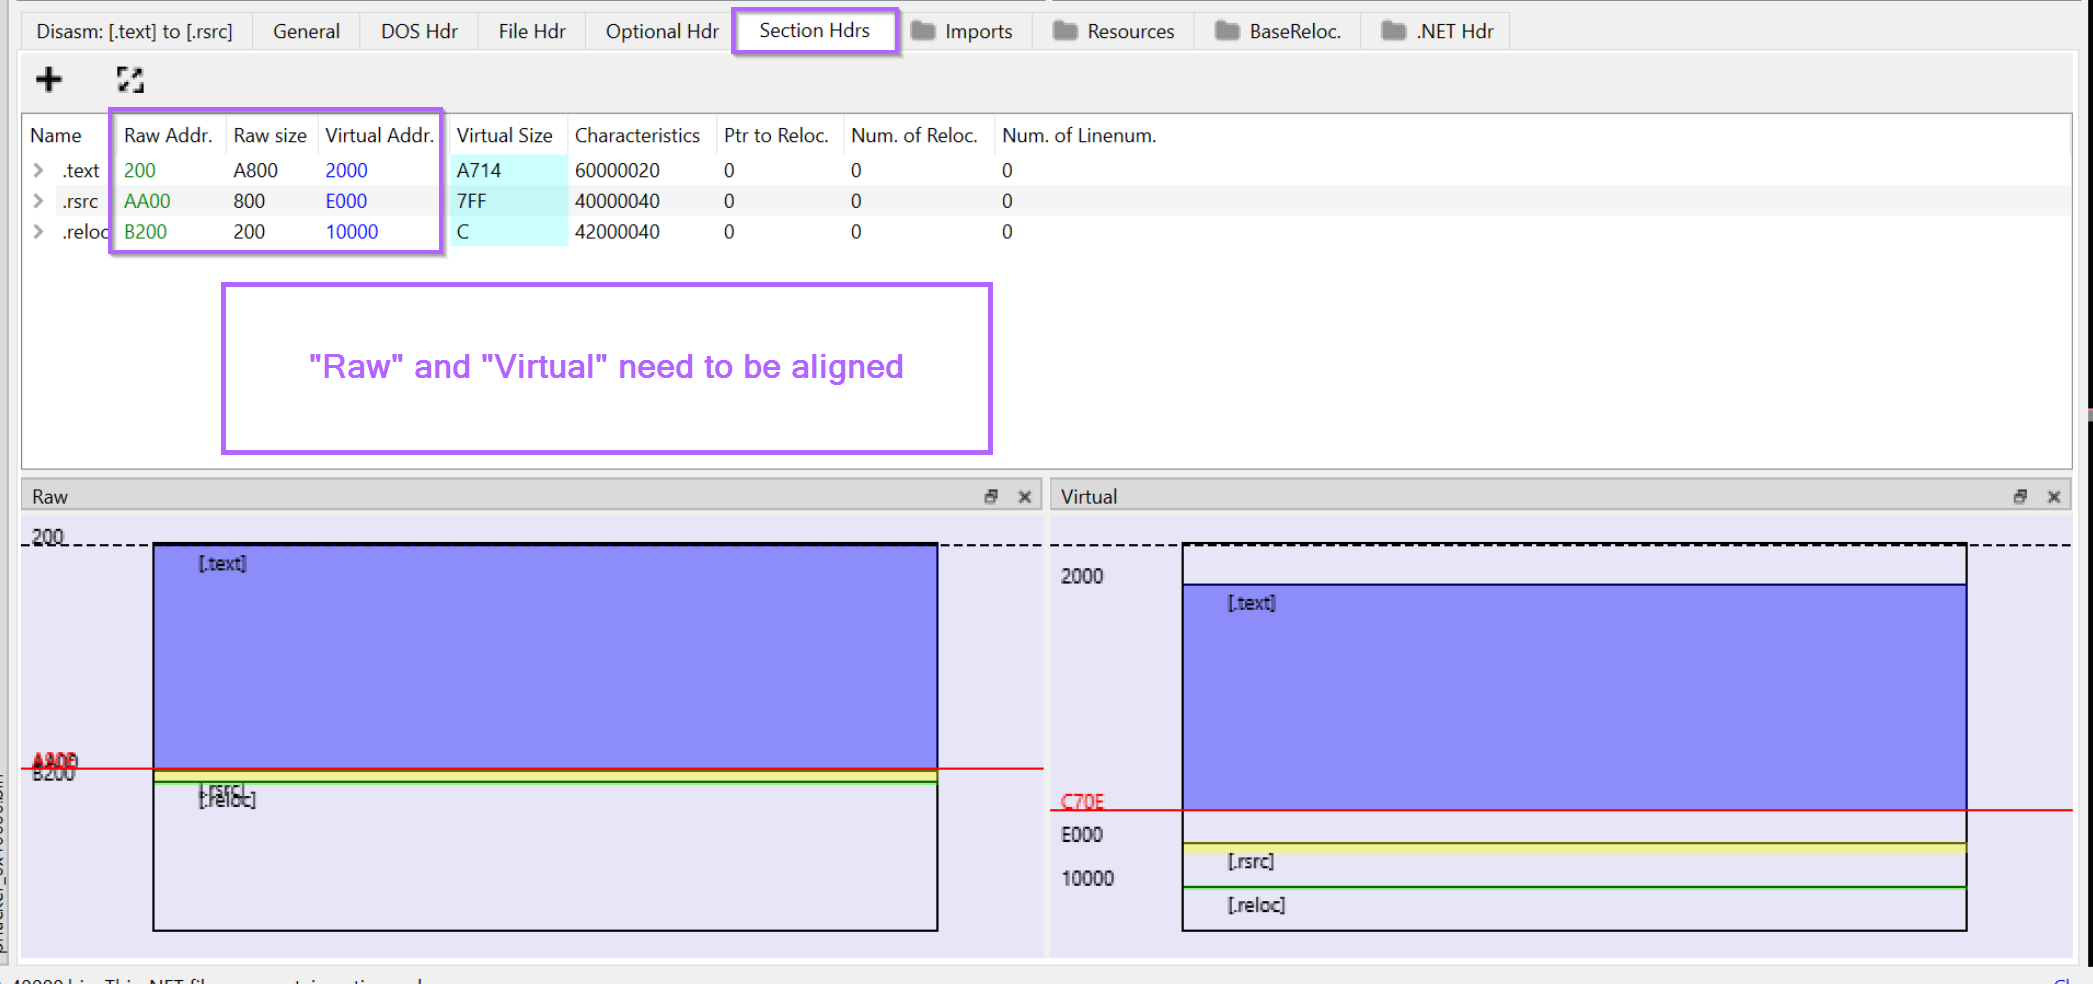
We can go ahead and click on each of the raw addresses and edit them to match that of the corresponding Virtual Address.
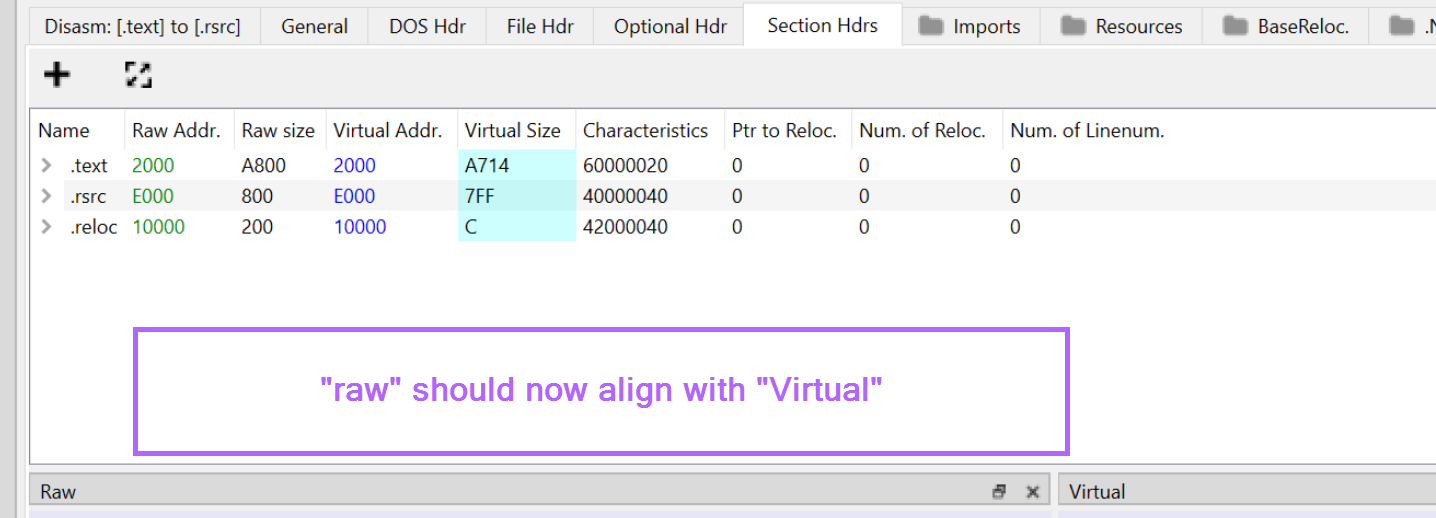
With the Raw and Virtual Addresses now aligned. We can right-click inside of the left window and save a new copy of the file.
We should create a new filename indicating that the file has been "fixed". I will go ahead and name the file phacker_fixed.bin
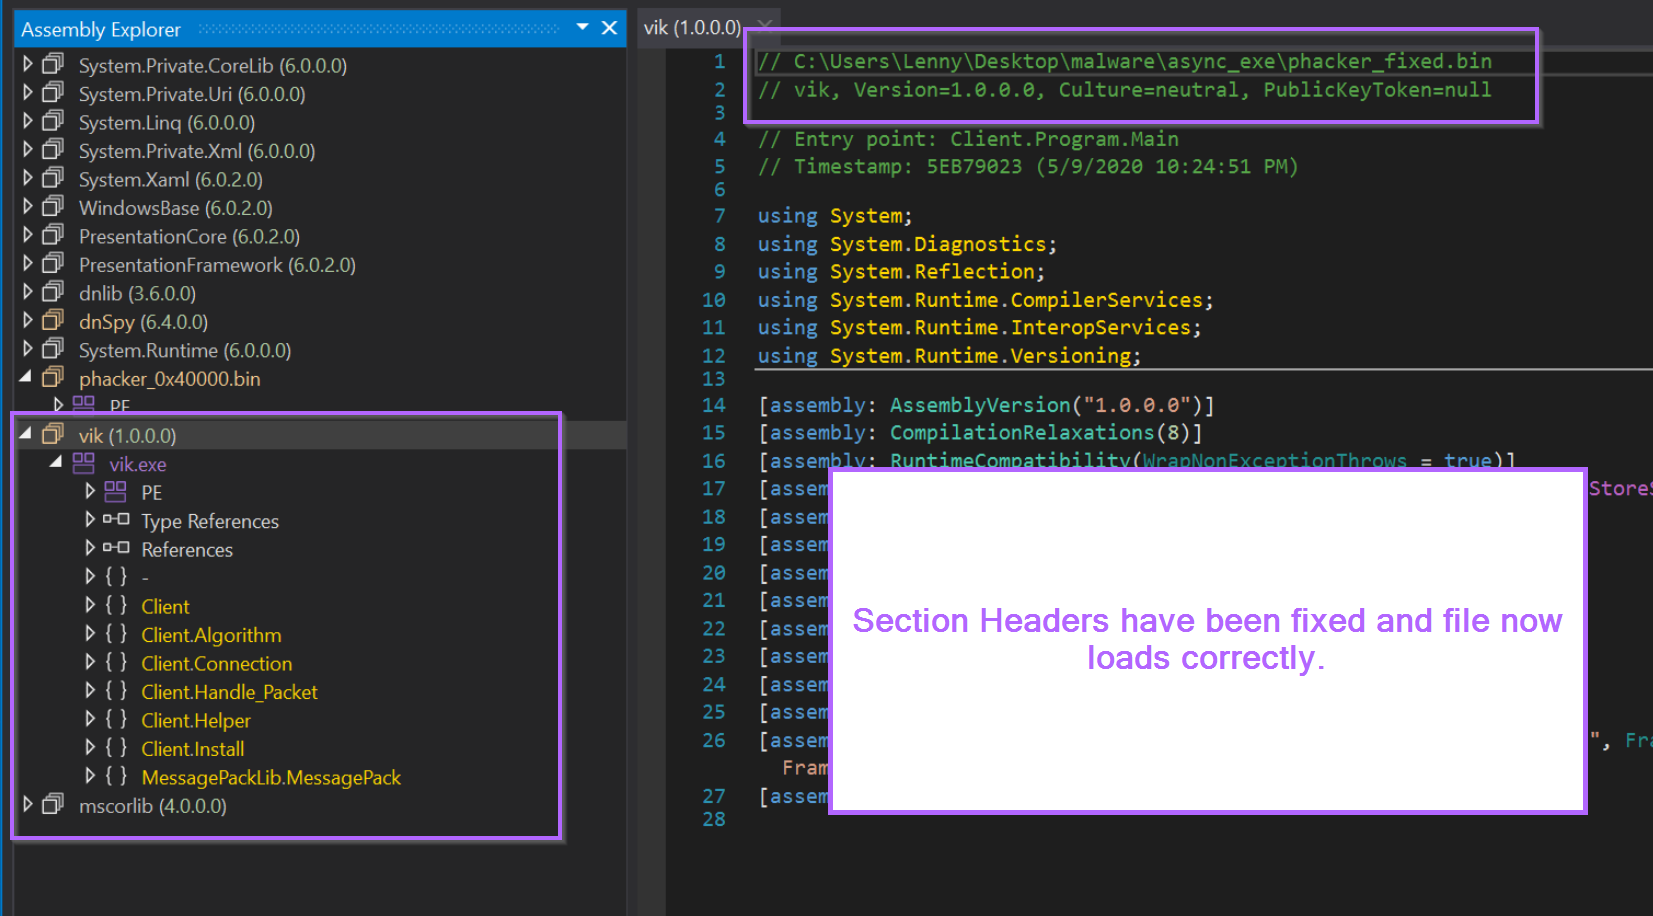
With the section headers now fixed, we can go ahead and re-open the file inside of Dnspy.
The file now loads successfully, with all relevant modules and decompiled code displayed correctly.
Another means for obtaining the unpacked payload, is to inspect running threads and dump memory using a traditional debugger such as x32dbg.
By inspecting threads and looking for anomalies, we can also see where threads are executing from. Using this information we can dump relevant memory.
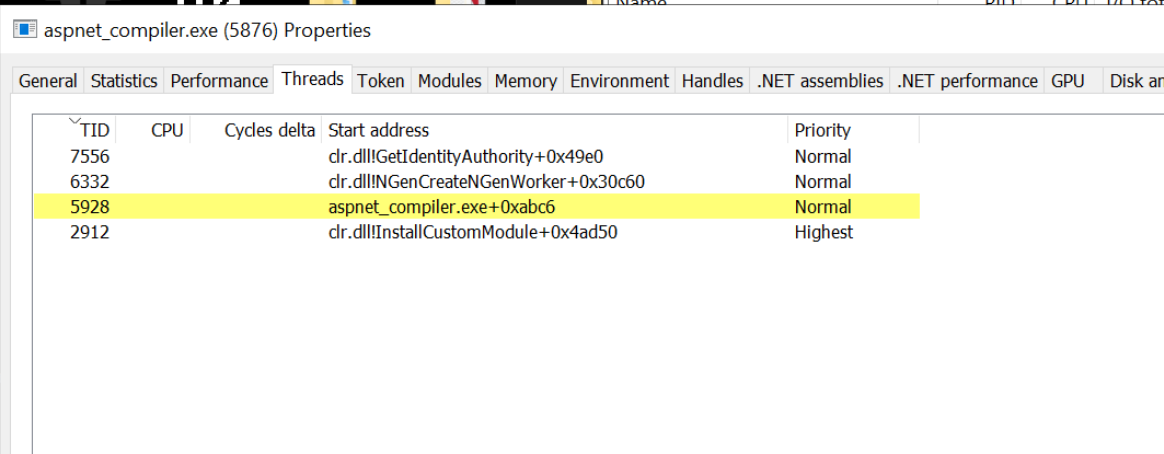
For example, we can use the threads tab to view running threads inside of the aspnet_compiler.exe process.
One of these threads stands out as different to the others. It's also running from aspnet_compiler.exe memory space which we already suspect may be overwritten with malicious content.
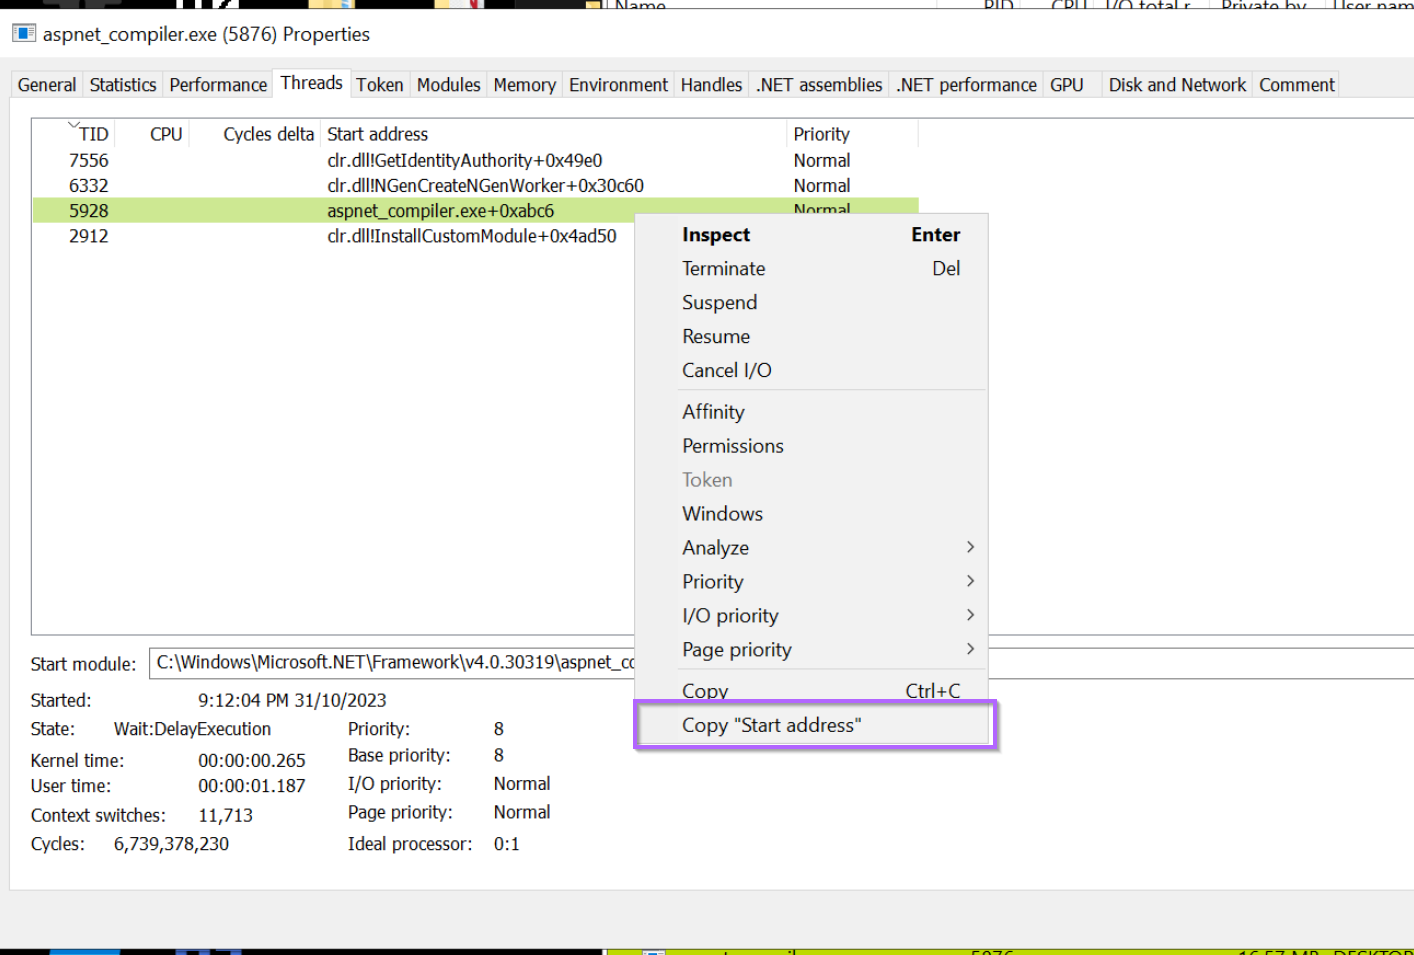
We can go ahead and copy the start address of this particular suspicious thread.
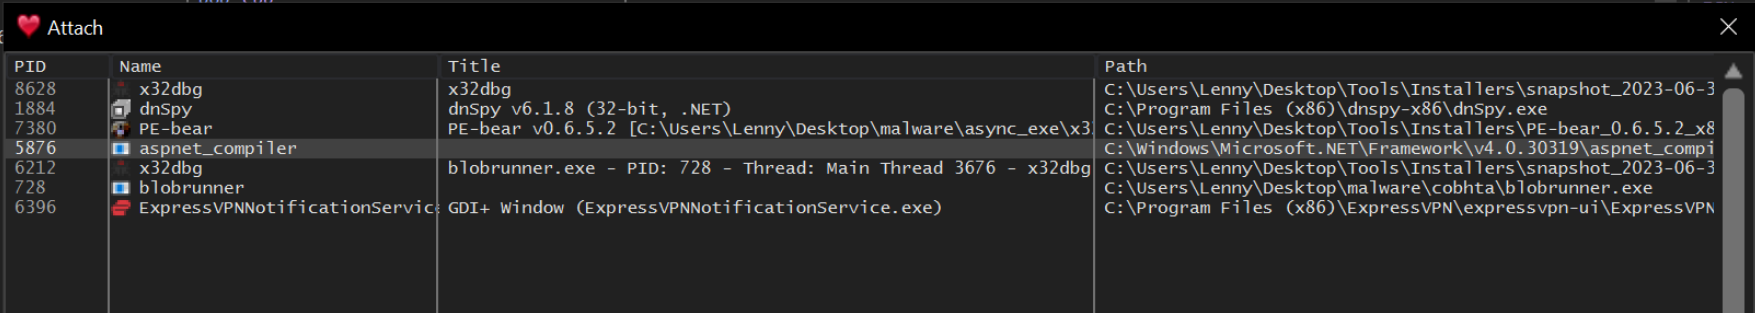
With a suspicious address now identified, we can go ahead and attach to aspnet_compiler.exe using x32dbg.
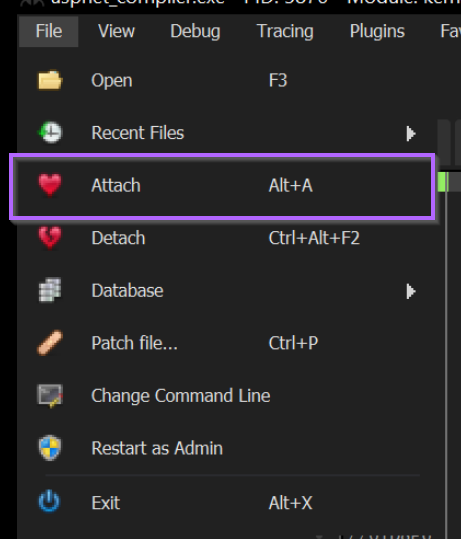
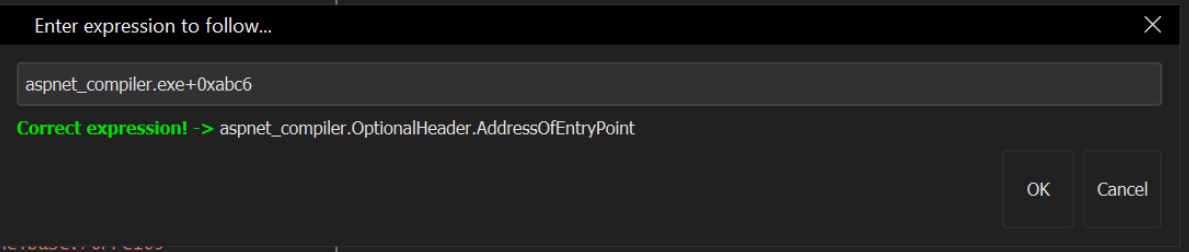
With the process selected and the debugger attached, we can go ahead and jump the starting location of the suspicious thread.
After jumping to the address, we can right click on the first address and find it's corresponding memory region.
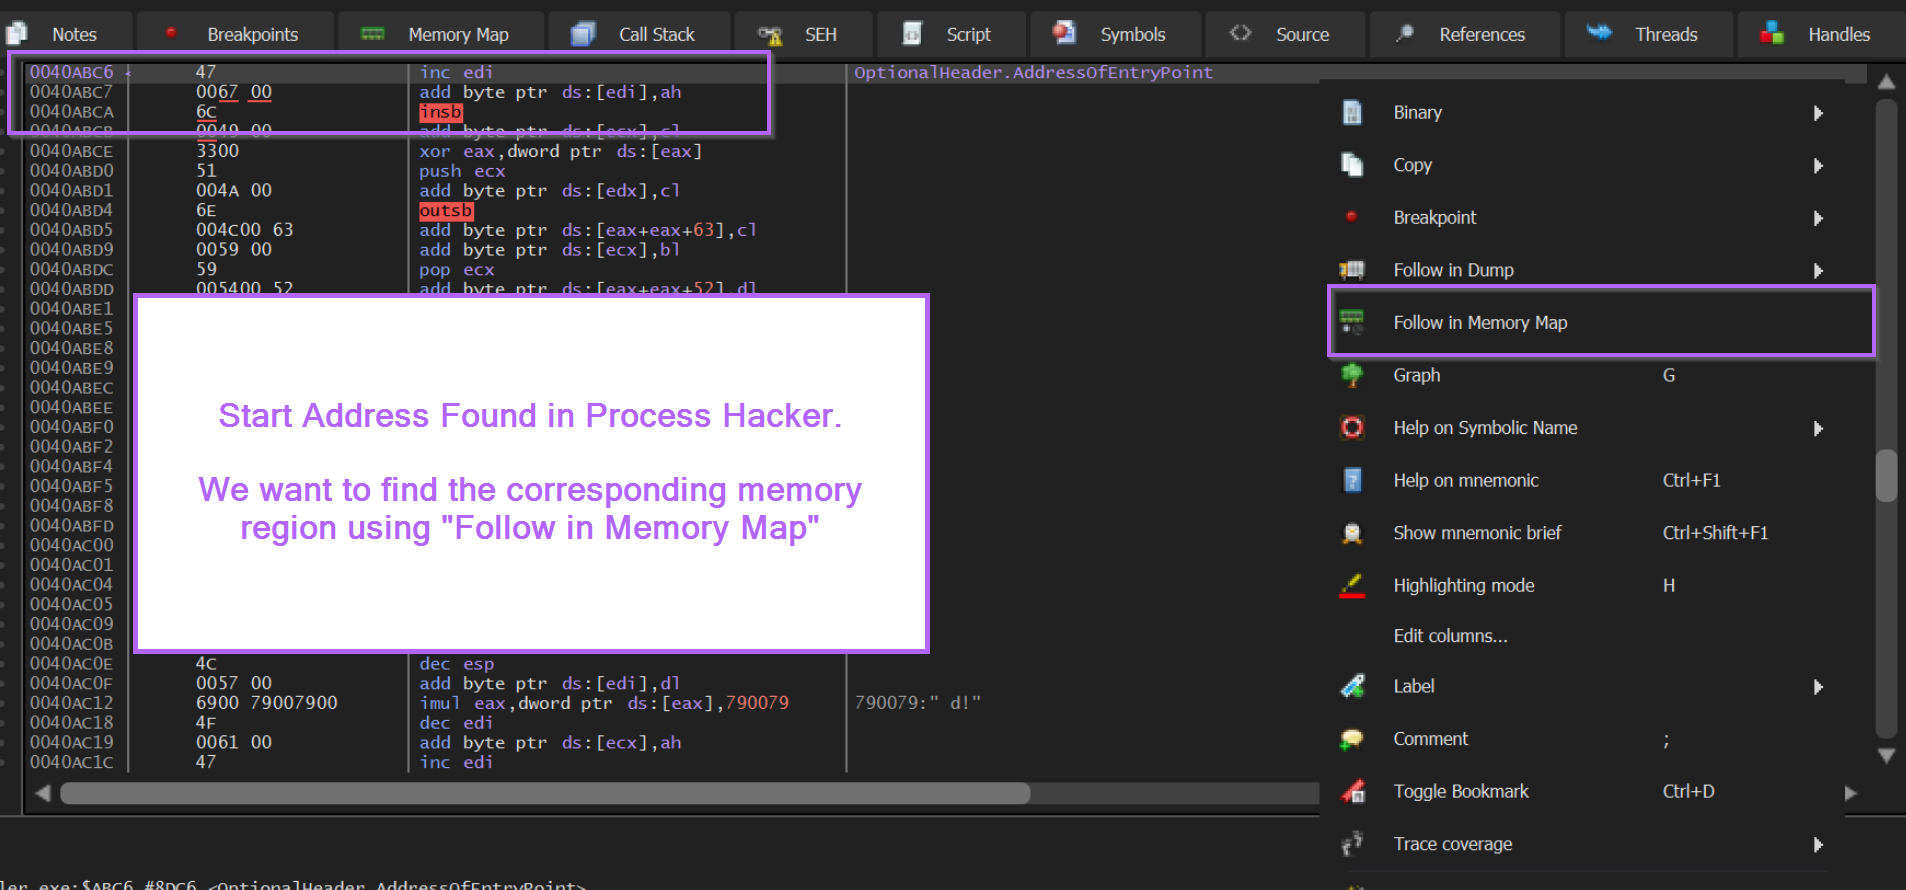
This will reveal a memory region of 0x40000, the same as identified by previous methods.
We can go ahead and save this region using "Dump Memory To File".
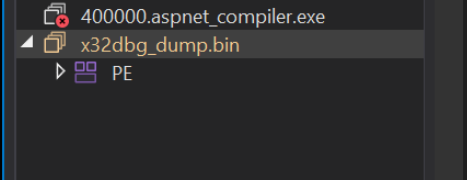
Saving this region to a file x32dbg_dump.bin, we will run into the same issue as the previous method when opening in DnSpy.
We can go ahead and re-align the sections as in the previous method.
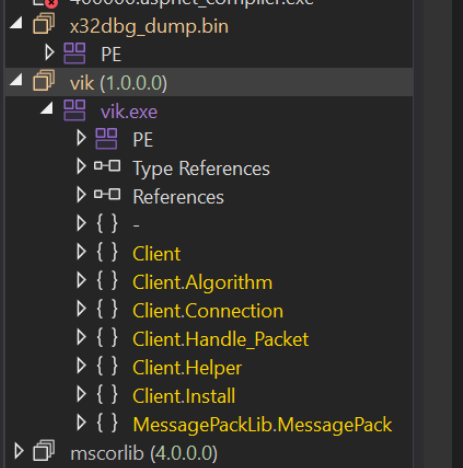
After correcting the section headers, the file loads successfully inside of DnSpy.
We have now obtained the unpacked payload by using Process Hacker and x32dbg.
We have now successfully obtained the unpacked payload using 3 different methods of varying complexity. No single method will work all of the time, so it's good to have multiple methods available.
Hopefully, you were able to recreate these methods and have learnt something new in this post.